

















Skip to content

Turn accounting data into business decisions

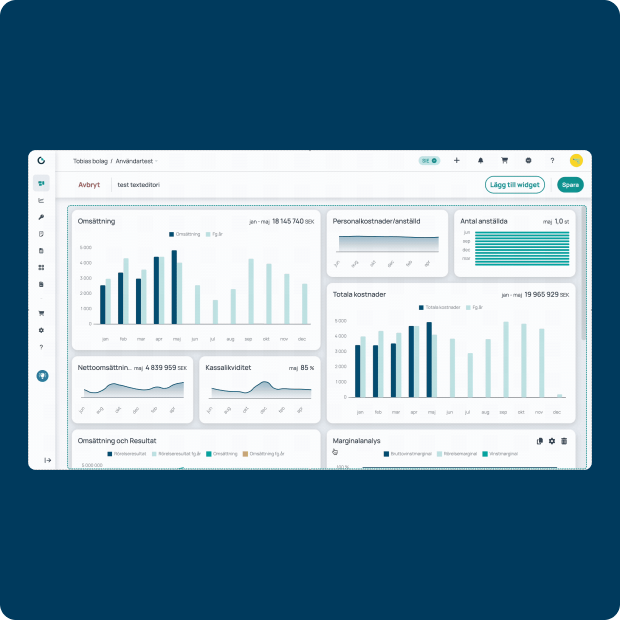
Income statements, budgets, KPIs, forecasts. Oxceed helps you manage it all. Make better decisions and increase profitability with the leading platform for visualizing, analyzing, and sharing your current and future financial data.

4.1 / 5 Used by over 20,000 companies and 200 accounting firms.

From numbers to direction

Most companies don’t struggle to access financial data — the challenge is bringing it together, understanding it, trusting it, and making it useful across the entire organization.

1.

The right data in the right place

Get started with Oxceed in minutes with ready-made templates or create the income statements, KPIs, budgets, and forecasts you need.

2.

Clarity. From detail to overview.

Oxceed transforms complex data into clear visualizations and reports that are easy to understand and analyze — allowing you to follow every figure all the way down to the details.

3.

Share and collaborate with confidence

Get started with Oxceed in minutes with ready-made templates or create the income statements, KPIs, budgets, and forecasts you need.

Trust the numbers. Understand the situation faster. Less hassle.

Discover Oxceed’s features that make financial data clear, reliable, and actionable — helping your entire organization move from accounting to direction.

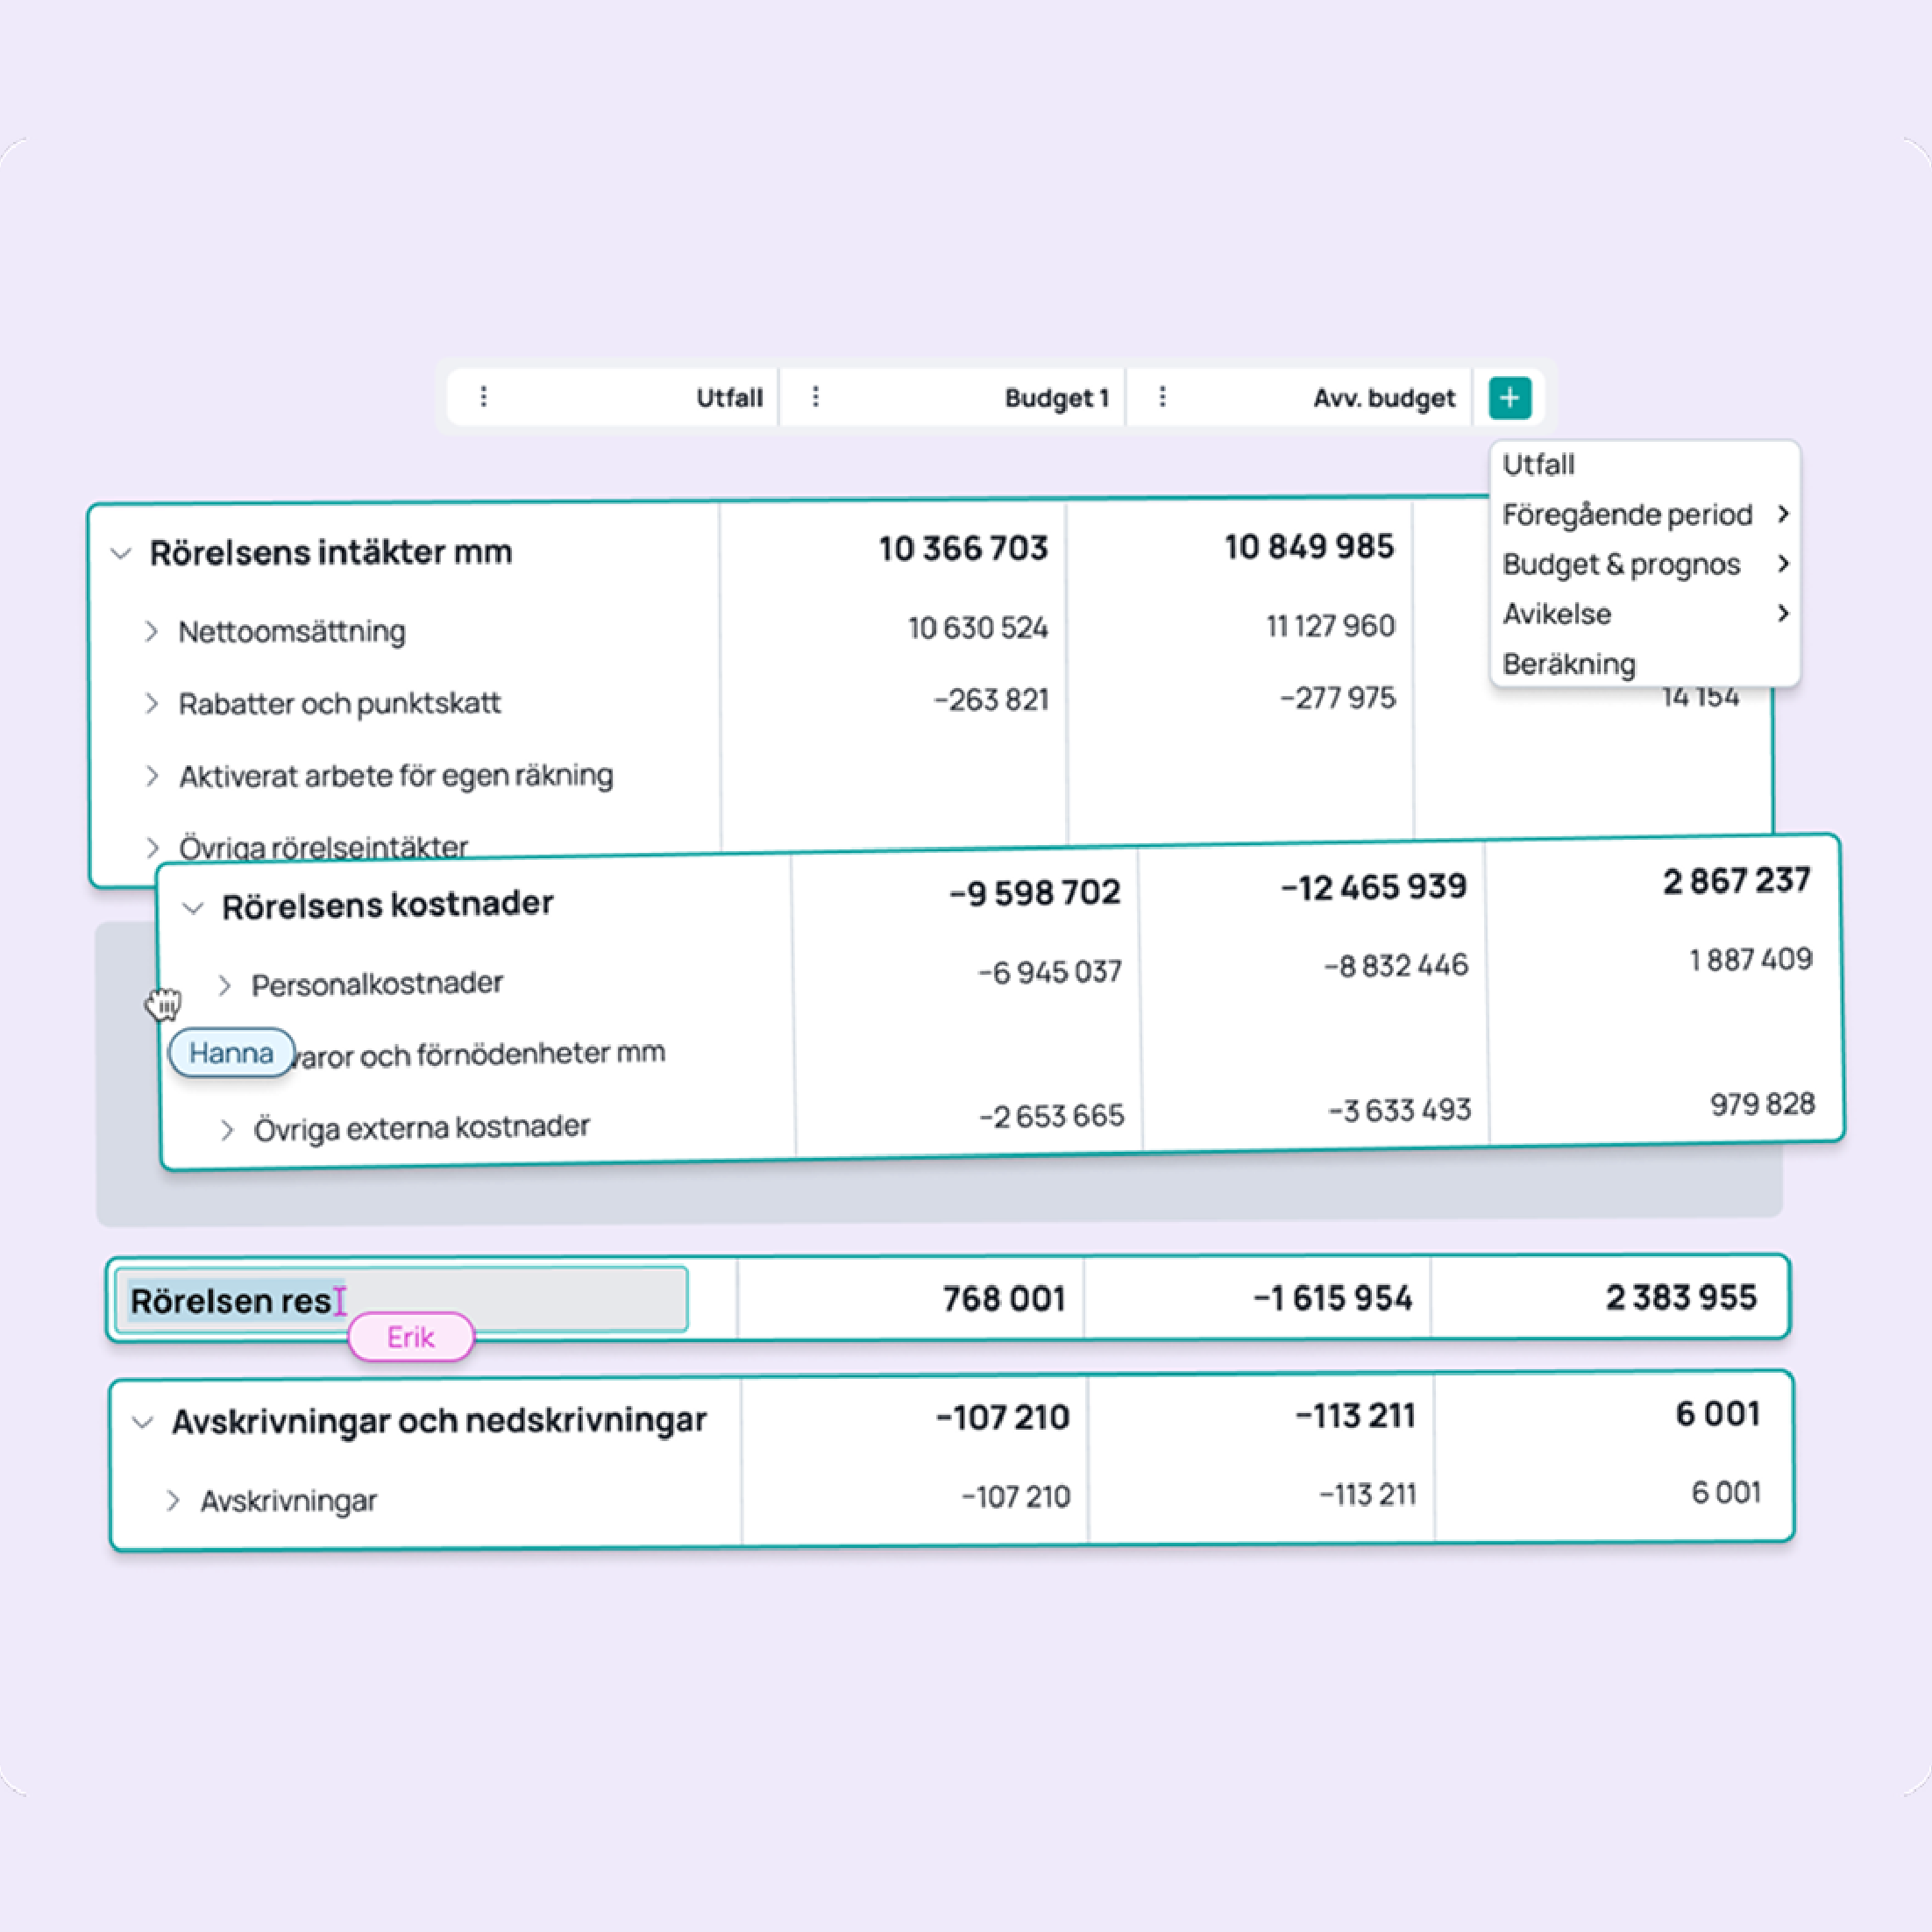
Customised financial reports
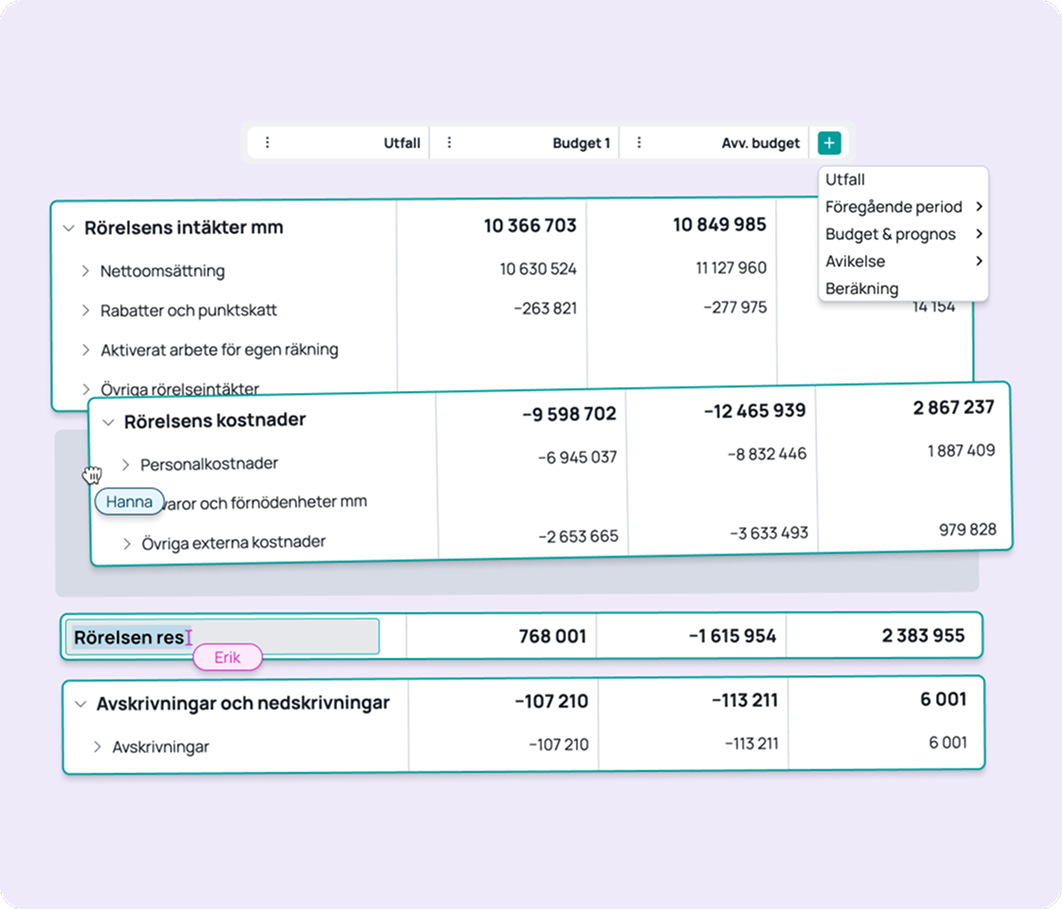
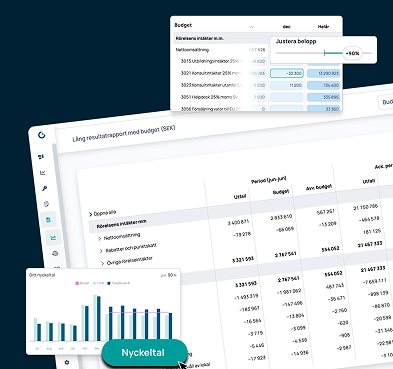
Create reports for management and the board with the structure, logic and level of detail that suit your business. Automate follow-up and move seamlessly from the big picture to the details within the same report.

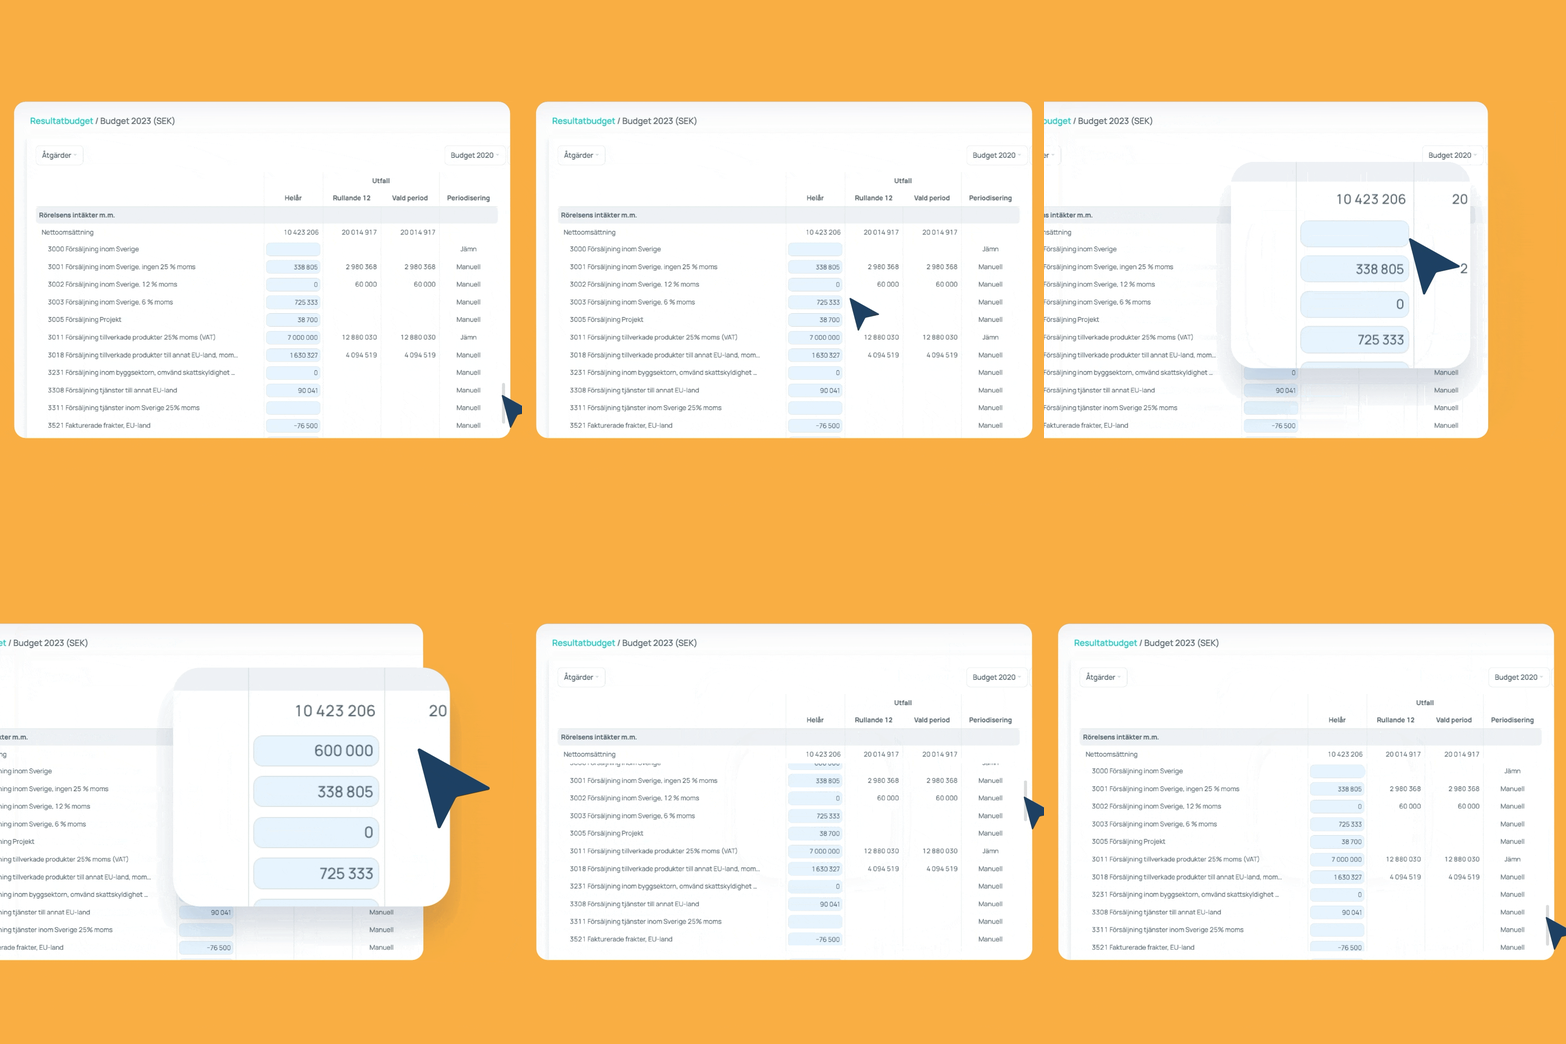
Simplify your budgeting and forecasting process

Create budgets, update forecasts continuously and compare them with actuals—all in the same tool. With support for multiple versions, scenarios and cost centres, you gain greater control, faster follow-up and more reliable insights for decision-making.

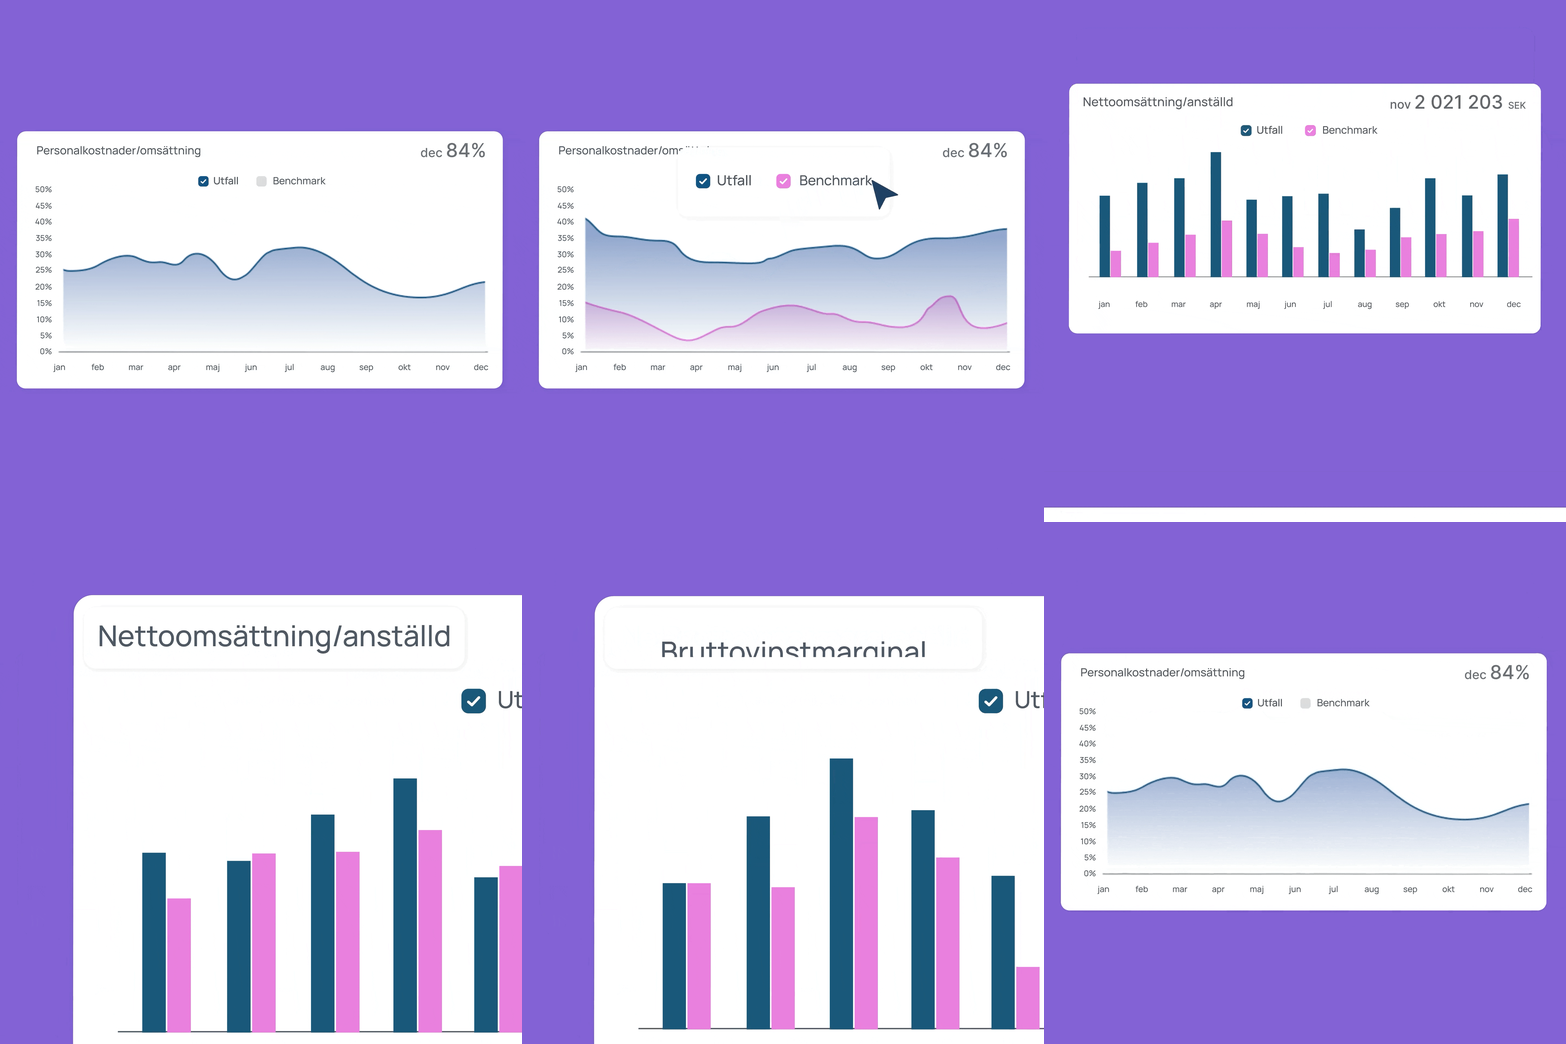
Focus on the right KPIs

Bring your company’s most important KPIs together in reports and dashboards, and track performance in real time. Choose from hundreds of standard KPIs or create your own, tailored to your business, so you can focus on what drives growth and make better decisions faster.

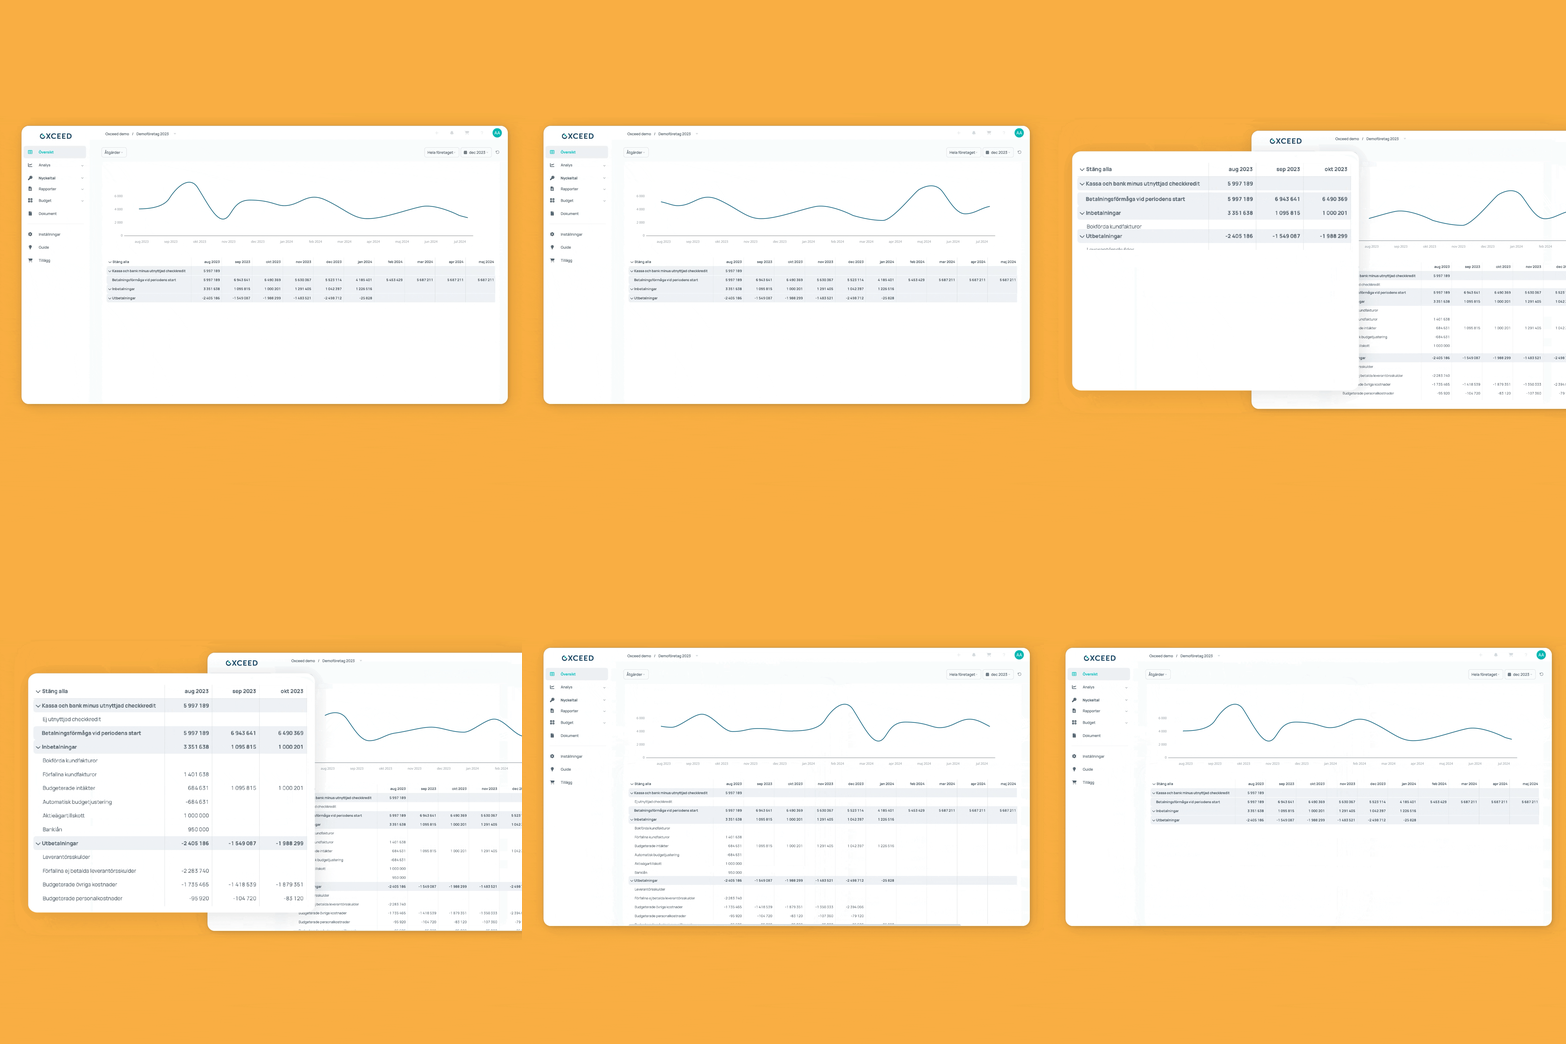
Gain better control of your cash flow

Start with your profit and loss budget and visualise how it affects cash flow over time. Automatic scheduling of incoming and outgoing payments gives you a clearer picture of your company’s ability to meet its financial obligations and a stronger basis for confident decision-making.

A dashboard that keeps everyone aligned

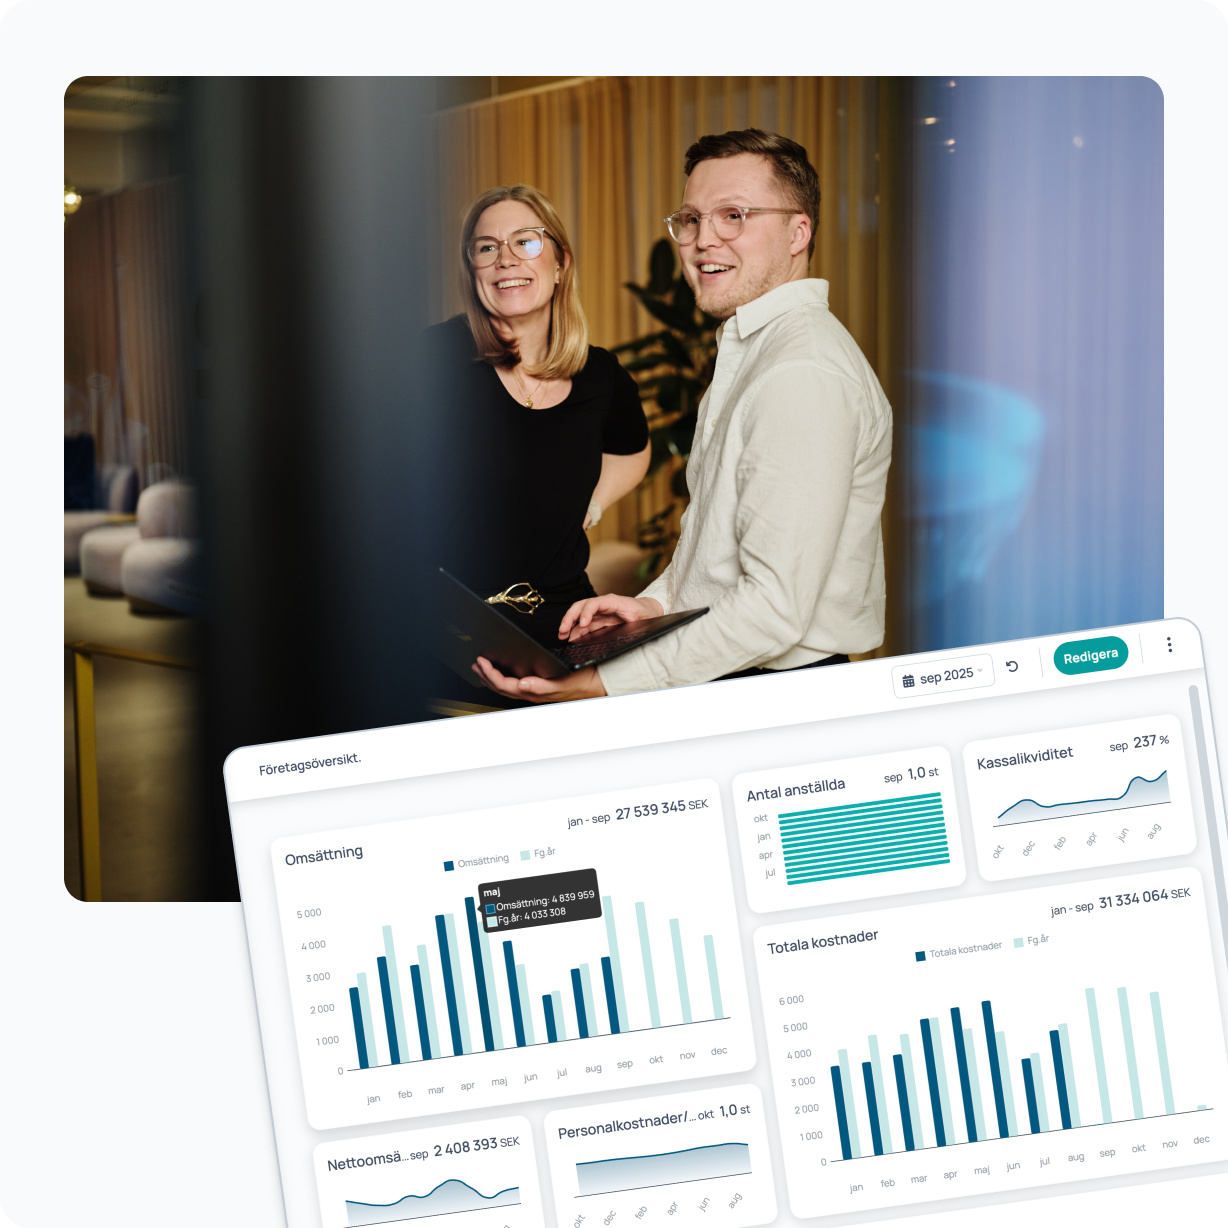
Bring your company’s most important figures together in a dashboard that provides a clear, shared overview. This makes it easier to understand the current situation, involve the right people in the right discussions and make better decisions.

Presentations that spark discussion
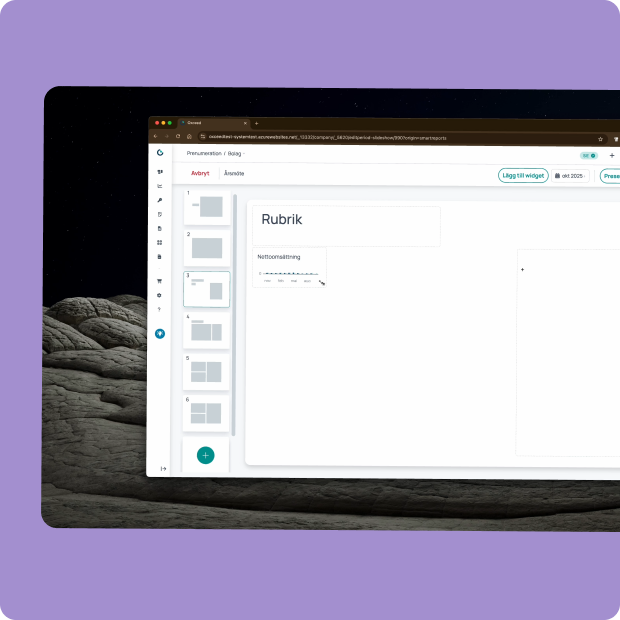
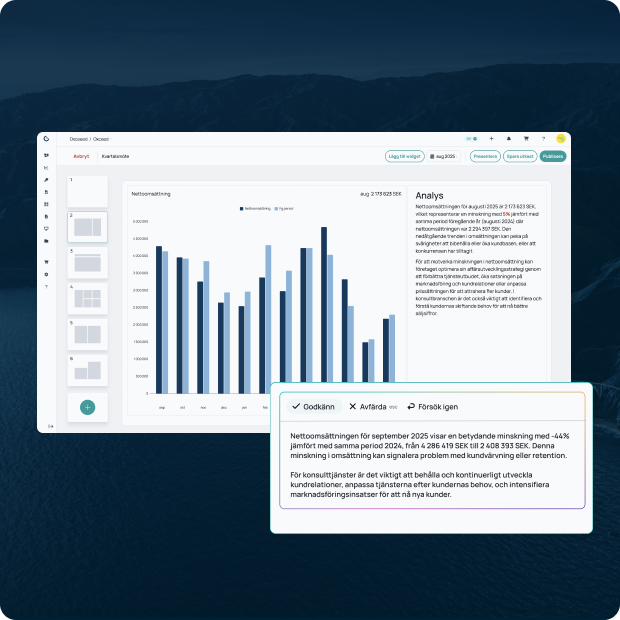
Build presentations for management, the board and colleagues using reusable templates that update automatically with the latest figures, charts and KPIs. This leads to clearer discussions, better priorities and more informed decisions in meetings.

Financial reporting for the entire group

Create reports for group management and the board with the structure, logic and level of detail that suit your group. Automate follow-up and move seamlessly from group level to individual companies, business areas or cost centres within the same report.

Simplify your group budgeting process

Create budgets, update forecasts continuously and compare them with actuals—all in the same tool. With support for multiple versions, scenarios, companies and cost centres, you gain greater control, more consistent follow-up and more reliable insights for decision-making across the group.

Focus on the right KPIs across the group

Bring your group’s most important KPIs together in reports and dashboards, and track performance in real time. Standardise reports and KPIs across companies, compare performance and create a clearer basis for faster decision-making.

Gain better control of your cash flow

Start with your profit and loss budget and visualise how it affects cash flow over time. Automatic scheduling of incoming and outgoing payments gives you a clearer picture of the group’s ability to meet its financial obligations and a stronger basis for confident decision-making.

A dashboard that keeps everyone aligned

Bring your group’s most important figures together in a dashboard that provides a clear, shared overview. This makes it easier to understand the current situation, compare performance across companies and bring the right people together around the right questions and decisions.

Financial reporting, tailored to each client

Create reports for each client’s management and board with the structure, logic and level of detail that suit the engagement. Automate follow-up and deliver professional reports faster, with less manual work and more time for analysis and advisory services.

Simplify the budgeting and forecasting process

Help your clients create budgets, update forecasts continuously and compare them with actuals—all in the same tool. With support for multiple versions, scenarios and cost centres, it becomes easier to structure the process, provide the right information and improve decision support.

Focus on the right KPIs

Bring each client’s most important KPIs together in reports and dashboards, and track performance in real time. Choose from hundreds of standard KPIs or create your own, tailored to different clients’ needs, so you can surface the right insights faster and have better client conversations.

Gain better control of your cash flow

Start with the profit and loss budget and visualise how it affects cash flow over time. Automatic scheduling of incoming and outgoing payments makes it easier to provide clients with a clear forward-looking view and help them act in time.

A dashboard that keeps everyone aligned

Bring each client’s most important figures together in a dashboard that provides a clear, shared overview. This makes it easier to understand the current situation, share the right insights with the right people and have better conversations about priorities and next steps.

Presentations that spark discussion

Build presentations for clients, management and boards using reusable templates that update automatically with the latest figures, charts and KPIs. This results in a more professional delivery, clearer discussions and more time for analysis and advisory services.

Company
Group
Agencies
Customised financial reports

Create reports for management and the board with the structure, logic and level of detail that suit your business. Automate follow-up and move seamlessly from the big picture to the details within the same report.

Create budgets, update forecasts continuously and compare them with actuals—all in the same tool. With support for multiple versions, scenarios and cost centres, you gain greater control, faster follow-up and more reliable insights for decision-making.

Bring your company’s most important KPIs together in reports and dashboards, and track performance in real time. Choose from hundreds of standard KPIs or create your own, tailored to your business, so you can focus on what drives growth and make better decisions faster.

Start with your profit and loss budget and visualise how it affects cash flow over time. Automatic scheduling of incoming and outgoing payments gives you a clearer picture of your company’s ability to meet its financial obligations and a stronger basis for confident decision-making.

Bring your company’s most important figures together in a dashboard that provides a clear, shared overview. This makes it easier to understand the current situation, involve the right people in the right discussions and make better decisions.

Build presentations for management, the board and colleagues using reusable templates that update automatically with the latest figures, charts and KPIs. This leads to clearer discussions, better priorities and more informed decisions in meetings.

Financial reporting for the entire group

Create reports for group management and the board with the structure, logic, and level of detail that suit your group. Automate reporting and move easily from the group level to an individual company, business unit, or cost centre within the same report.

Create budgets, update forecasts continuously, and compare them with actual results in the same tool. With support for multiple versions, scenarios, companies, and cost centres, you gain better control, more consistent reporting, and a more reliable basis for decisions across the group.

 
17:47

Bring the group’s most important KPIs together in reports and dashboards, and track performance in real time. Standardise reports and KPIs across companies, compare performance, and build a clearer basis for faster decisions.


Start with the profit and loss budget and see how it affects cash flow over time. Automatic scheduling of incoming and outgoing payments gives you a clearer picture of the group’s ability to meet its obligations and a stronger basis for confident decisions.


Bring the group’s most important figures together in a dashboard that gives everyone a clear overview. This makes it easier to understand where things stand, compare performance across companies, and bring the right people together to discuss the right questions and decisions.

 
17:48
Financial reporting, tailored to each client

Create reports for each client’s management team and board, with the structure, logic, and level of detail that suit the engagement. Automate reporting and deliver professional reports faster, with less manual work and more time for analysis and advice.

Help clients create budgets, update forecasts regularly, and compare them with actual results in the same tool. With support for multiple versions, scenarios, and cost centres, it’s easier to structure the process, provide the right information, and support better decisions.

Bring each client’s most important KPIs together in reports and dashboards, and track performance in real time. Choose from hundreds of standard metrics or create KPIs tailored to each client’s needs, so you can highlight the right insights sooner and have more productive conversations with clients.

Start with the profit and loss budget and see how it affects cash flow over time. Automatic scheduling of incoming and outgoing payments makes it easier to give clients a clear view of what lies ahead and help them act in time.


Bring each client’s most important figures together in a dashboard that gives everyone a clear overview. This makes it easier to understand where things stand, share the right insights with the right people, and have better conversations about priorities and next steps.

Create presentations for clients, management teams, and boards using reusable templates that update automatically with the latest figures, charts, and KPIs. Deliver a more professional result, make discussions clearer, and free up more time for analysis and advice.

Get started with
Oxceed today

1. Create an account

Create an account in minutes. Try Oxceed free for 10 days with no commitment.


2. Connect your systems

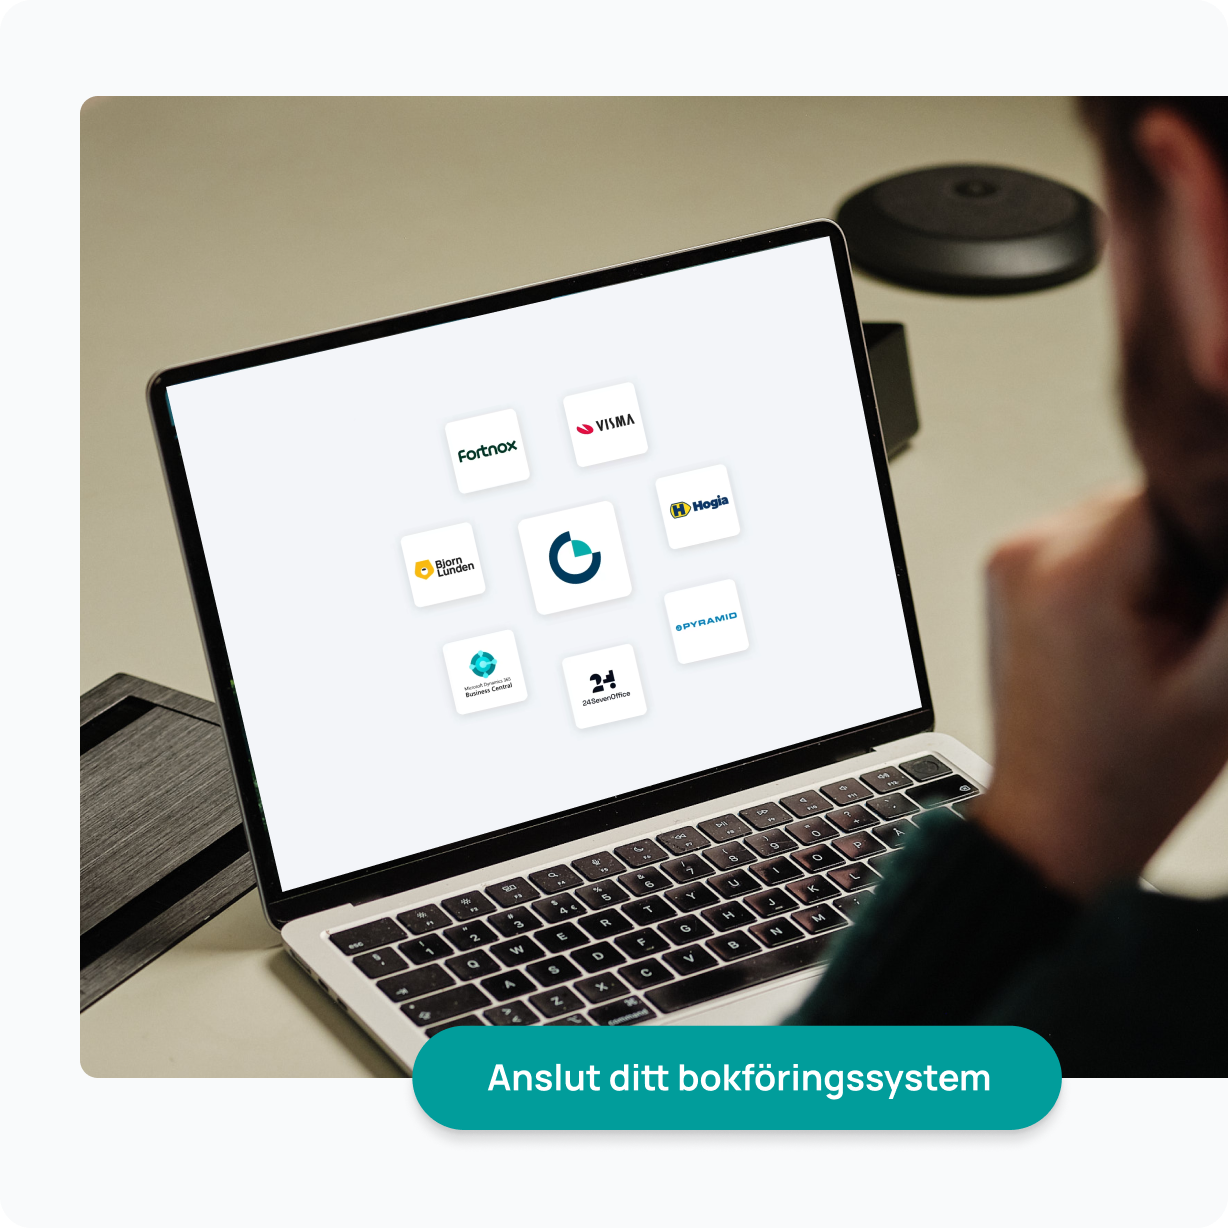
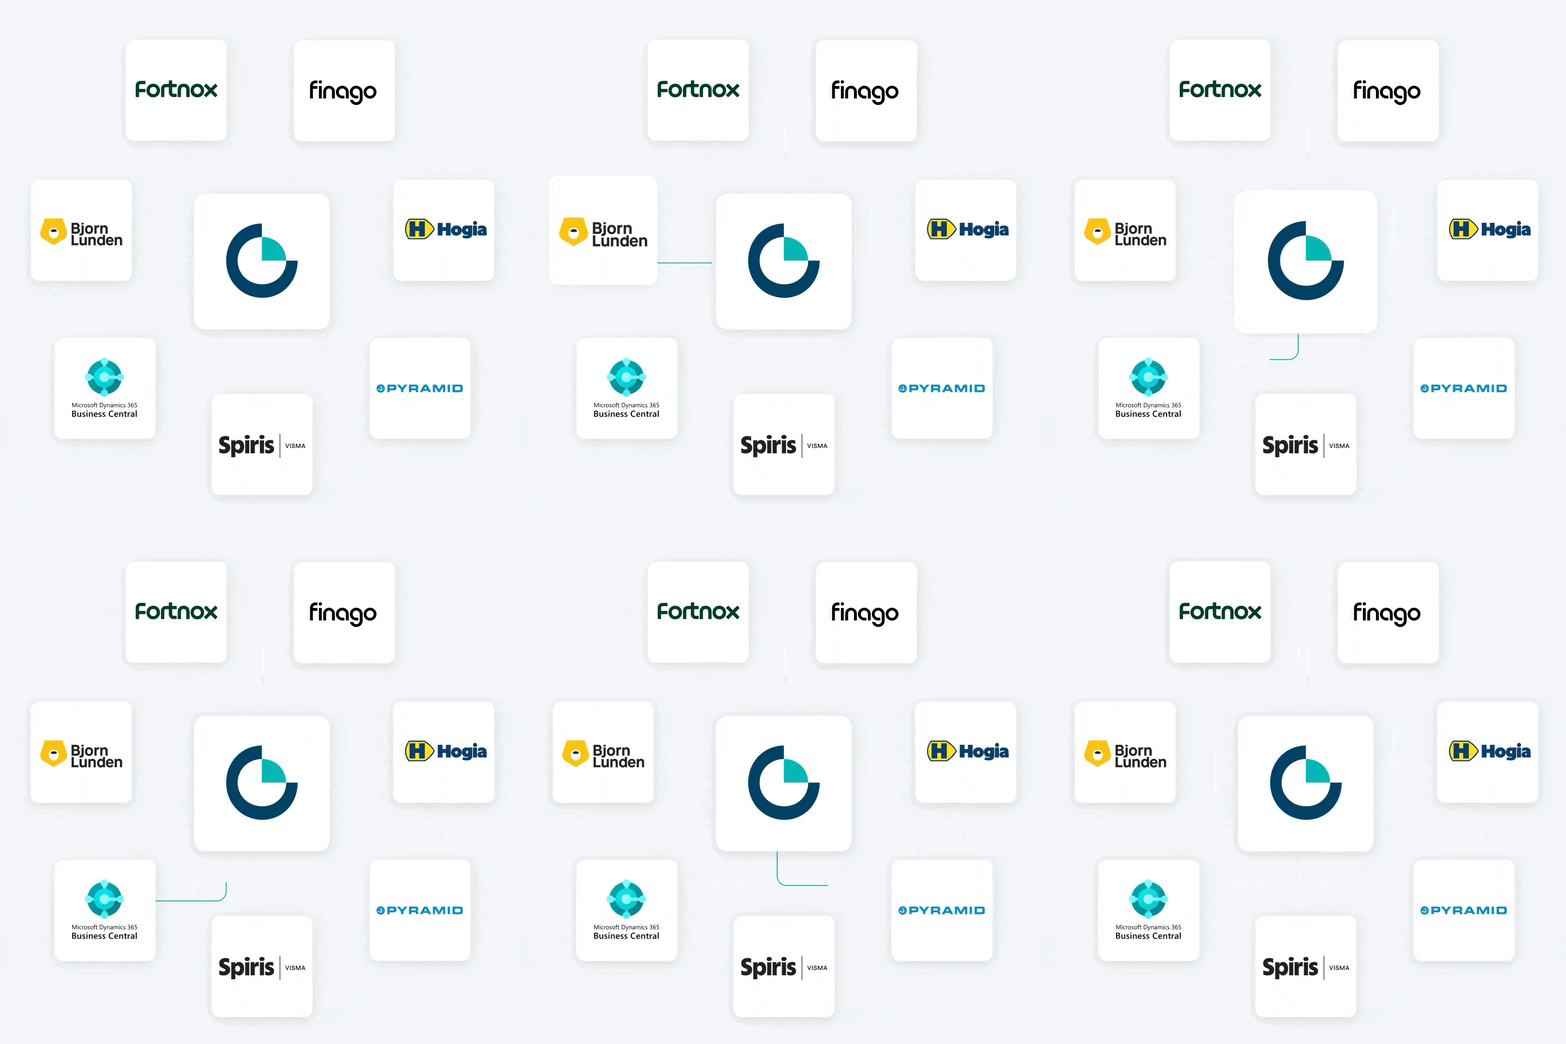
Connect quickly and easily to the most popular accounting systems to view your financial data in real time, or import an SIE file.

3. Share insights

Create clear reports and share them with colleagues, management, or clients.

Get started with Oxceed today

1. Create an account

Create an account in minutes. Try Oxceed free for 10 days with no commitment.

Connect quickly and easily to the most common business systems to view your accounting data in real time, or import an SIE file.

Skapa tydliga rapporter och dela dem med kollegor, ledning eller kunder.

Get connected in no time

Connect quickly and easily to the most widely used accounting systems, whether you’re a company or an accounting firm.